REFLECTION 3
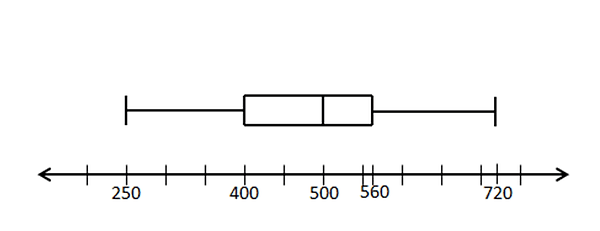
This week I learned how to make a box-plot graph and I also learned about permutations. With the box-plot graph there are 6 different parts, there is the minimum, first quartile, media, third quartile, maximum, and the outlier. To construct a box-plot we use rectangular box and the endpoints of the box are the first and third quartiles. We also need to solve for the 1.5 IQR in order to identify the markers. The lowest marker would be Q1 - 1.5 IQR. The highest is Q3 + IQR. These are also known as the lower boundary and the upper boundary. The outlier would be symbolized by an asterisk and we only mark it if the remaining data is outside of the range. On the side is an example of a box-plot graph.
Permutations are objects in an ordered arrangement of objects. We use permutations in order find N amount of ways or probabilities with certain situations. An example would be: How can you arrange 10 children in a row if two of them wants to sit together? The formula for permutation is nPr=n!/(n-r)!. There is also the circular permutation an example of this: How can you arrange 5 people in a circular table? And the formula for this is (n-1)!